The USDJPY pair has gained attention as it continues to climb. It is now trading at 155.82, with a 0.76% increase in the latest session. The different approaches of the U.S. Federal Reserve and the Bank of Japan primarily drive this rise. While the Fed maintains higher interest rates, Japan's loose monetary policies have weakened the yen, making the dollar more attractive to traders.
Strong U.S. retail sales data have boosted confidence in the American economy, adding to the dollar's strength. On the other hand, Japan's limited efforts to support its currency have left the yen under more pressure. Traders are now watching closely to see if this bullish momentum in USDJPY can continue or if any market shifts might slow its rise.
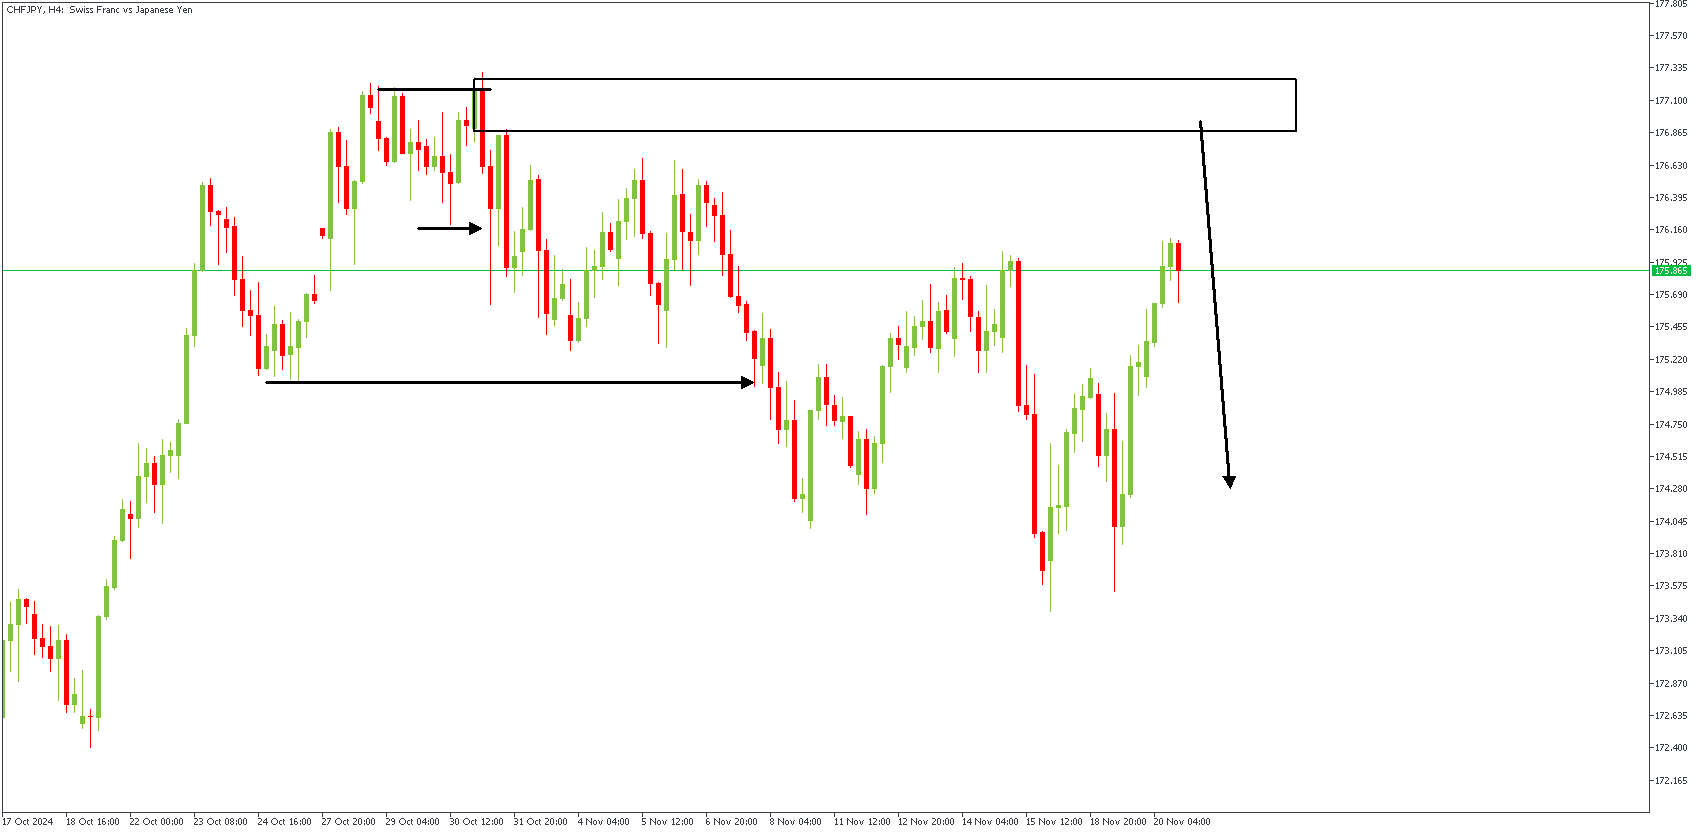
CHFJPY – H4 Timeframe

The SBR pattern is a price action pattern that describes a sweep of liquidity, followed by a proper break of structure and then a retest. This is what I believe is at play on the 4-hour timeframe chart of CHFJPY. The initial supply zone is expected to be tested so that the price can continue its bearish run.
Analyst's Expectations:
Direction: Bearish
Target: 173.984
Invalidation: 177.476
GBPJPY – H3 Timeframe
.png)
After the bearish break of the structure, the price is currently retracing toward the supply zone responsible for the break. The highlighted supply zone enjoys further confluence from factors like the trendline resistance and the 88% Fibonacci retracement level.
Analyst's Expectations:
Direction: Bearish
Target: 194.595
Invalidation: 199.518
CONCLUSION
You can access more trade ideas and prompt market updates on the Telegram channel.


