
Technical Analysis
XTIUSD, Daily
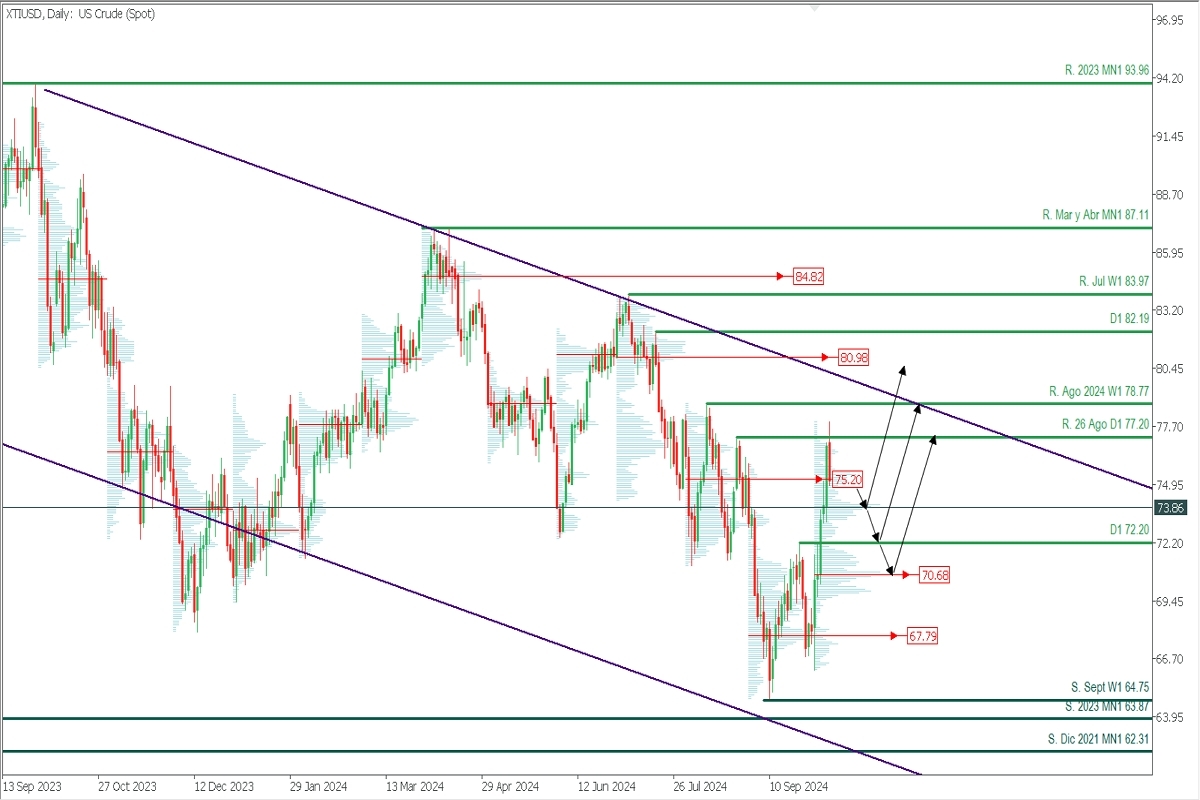
- Supply Zones (Selling): 81.01
- Demand Zones (Buying): 73.97, 70.71, and 67.80
The pair has been trading within a bearish channel for over a year, and analyzing the most recent price rise, it can be determined that although the rally from September and into October indicates a broad correction within the macro bearish trend, the downtrend remains intact. This is because the last validated weekly resistance, at the August high of 78.77, has not been decisively broken or confirmed by two solid movements.
However, we can observe a first break of the daily resistance from August 26th, signalling an initial alert for the bears due to the challenge to the technical structure and the break of the August supply zone around 75.20, converting it into a key volume support.
In this scenario, if this key volume zone acts as support, it will drive new buying opportunities to break the August resistance at 78.77.
On the other hand, a pullback below 75.20 could target the high-volume node at 73.97, the weekly opening zone, followed by the broken level at 72.20, where the highest volume concentration of October starts, with its POC at 70.71. Buying could resume here with the potential to reverse the bearish trend.
However, the unlikely calm in the geopolitical landscape could strengthen the bears, leading to a break below the aforementioned demand zones, especially September's zone with the uncovered POC at 67.80.
WTIUSD, H1
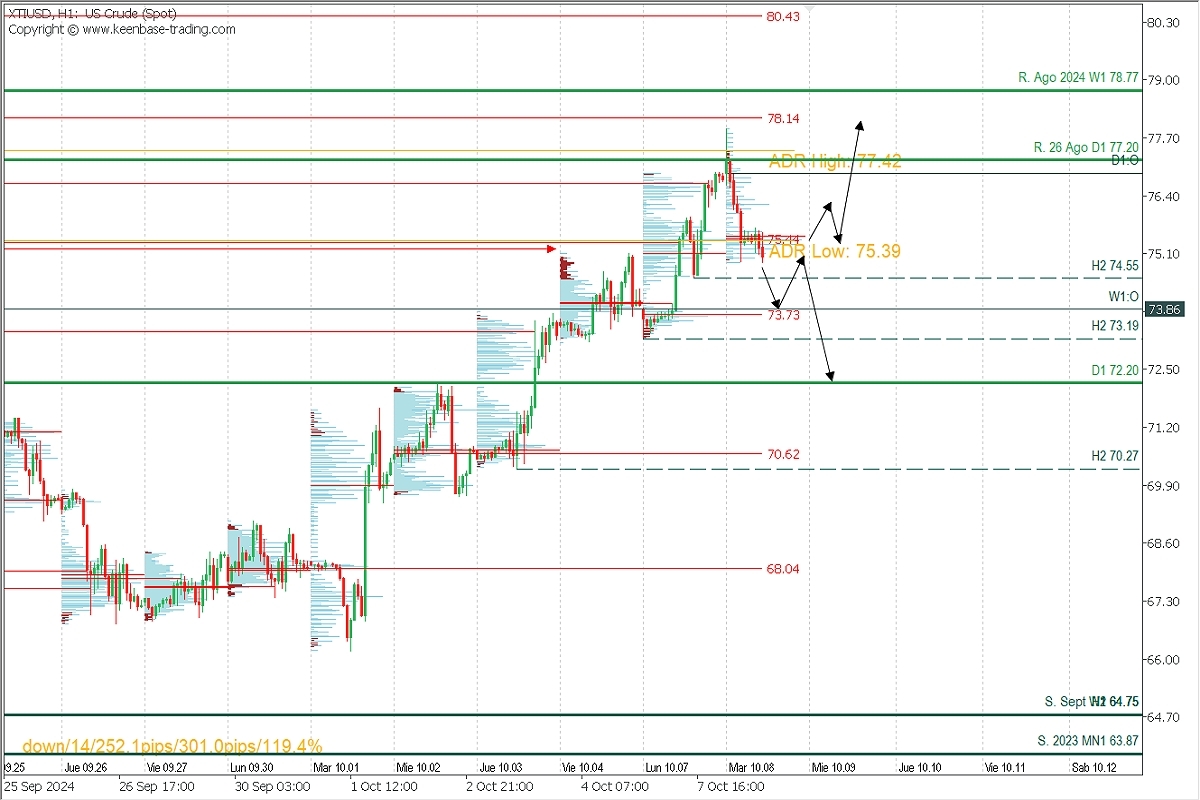
The intraday technical structure is bullish, with validated support at 74.55. This implies that as long as this level holds, we continue to favour buying, with targets at 78.00, the uncovered POC at 78.14, and the August resistance at 78.77. On the other hand, a break below 74.55 would target the local demand zone at 73.73, with a broad bullish potential if the reaction surpasses the volume concentration from the early sessions at 75.44, or continued bearishness if the reaction is weak.
Technical Summary:
- Buys above 75.50 with TP at 77.00, 78.00, 78.14, or 78.77 on extension. Use a 1% risk SL of your capital with a low lot size to allow for movement.
- Sells below 74.55 with TP at 73.73, 73.19, and 72.20 on extension. Use a 1% risk SL of your capital.
- Always wait for the formation and confirmation of an Exhaustion/Reversal Pattern (ERP) on M5, as we teach you [here](https://t.me/spanishfbs/2258), before entering any trade in the key zones we have indicated.
Uncovered POC: POC = Point of Control: It is the level or zone where the highest volume concentration occurred. If a bearish move followed, it’s considered a selling zone, forming resistance. Conversely, if a bullish impulse occurred, it’s considered a buying zone, usually located at lows, forming support zones.
@2x.png?quality=90)


