XNGUSD, H4
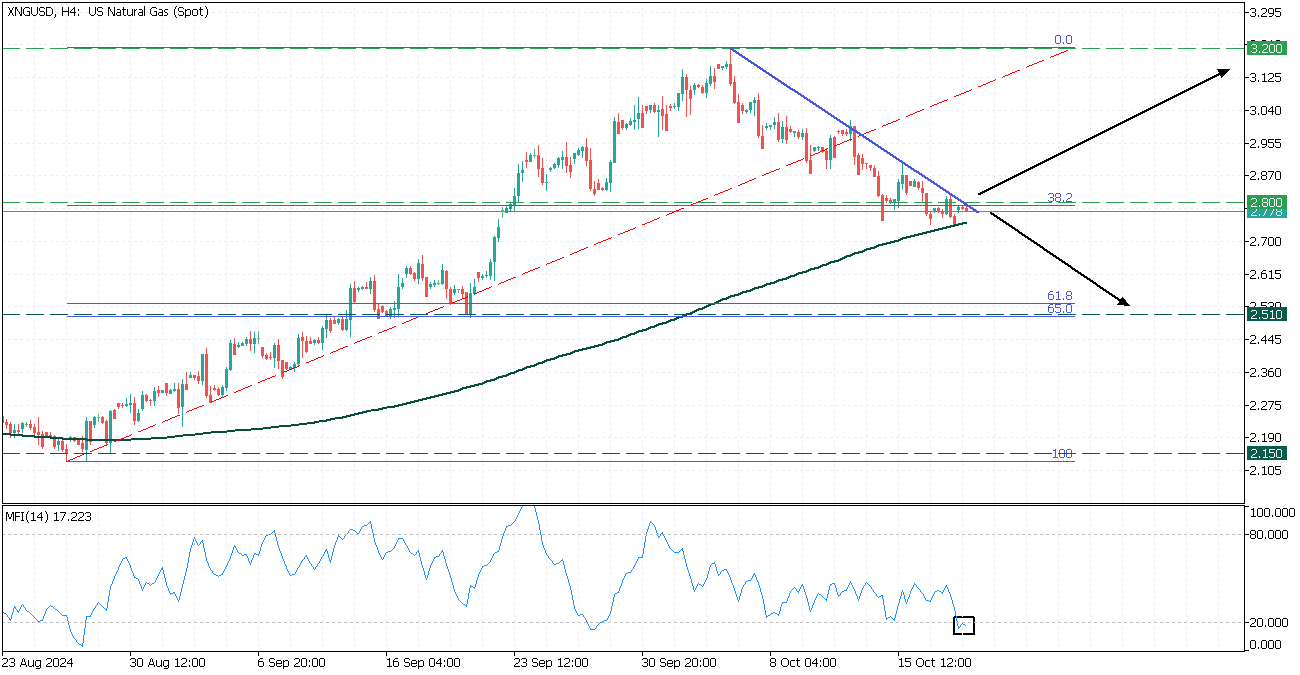
On the H4 timeframe, XNGUSD navigates within a a trendline and faces the 2.80 support at the 38.2 Fibonacci ratio.
The MFI oscillator shows an oversold conditions and a 200-MA giving an extra support layer, putting pressure on sellers.
- If the price breaks above the trendline, it may skyrocket XNGUSD to 3.20 resistance.
- However, breaching below the 38.2 Fibonacci and 200-MA support, will trigger a decline to 2.51 at the golden Fibonacci ratio.